Nitrous oxide (N2O) is the third most important greenhouse gas (GHG) after carbon dioxide (CO2) and methane (CH4). Its global warming potential is about 300 times larger than CO2 for a 100 year timescale. Surface in-situ observations show that N2O is steadily rising since the 1970's. This positive trend is mostly caused by the rapid increase of the worldwide use of nitrogen fertilizers in the agricultural practices. About two thirds of atmospheric N2O are also emitted by oceanic and continental ecosystems and the distribution of its global emissions remains highly uncertain. Indeed, with an about 100 years lifetime the N2O spatio temporal variability is very low preventing a clear identification of its sources. Moreover, thermal infrared sensors are able to detect N2O but they are less sensitive close to the Earth’s surface than near infrared sensors used for CO2 and CH4 observations. The documentation of N2O emissions from space is therefore a real challenge.
The SOFRID retrieval software has been developed at LAERO (CNRS-Université de Toulouse/France) since 2009 to retrieve O3 and CO profiles from IASI data. It has been updated recently to retrieve N2O profiles. For the first time, IASI data have been used to document the seasonal variations and the decadal trends of this GHG at the global scale. These new SOFRID-N2O data have been validated with FTIR retrievals from 12 stations of the NDACC. Noteworthy, IASI and FTIR data produce similar N2O trends of about 1.05 ppbv/year in the mid-troposphere. Moreover, the comparison with NDACC data has highlighted that N2O middle and upper tropospheric seasonal variabilities are partly captured by SOFRID retrievals. This preliminary study opens new perspectives to improve the knowledge of the N2O sources distribution with IASI data.
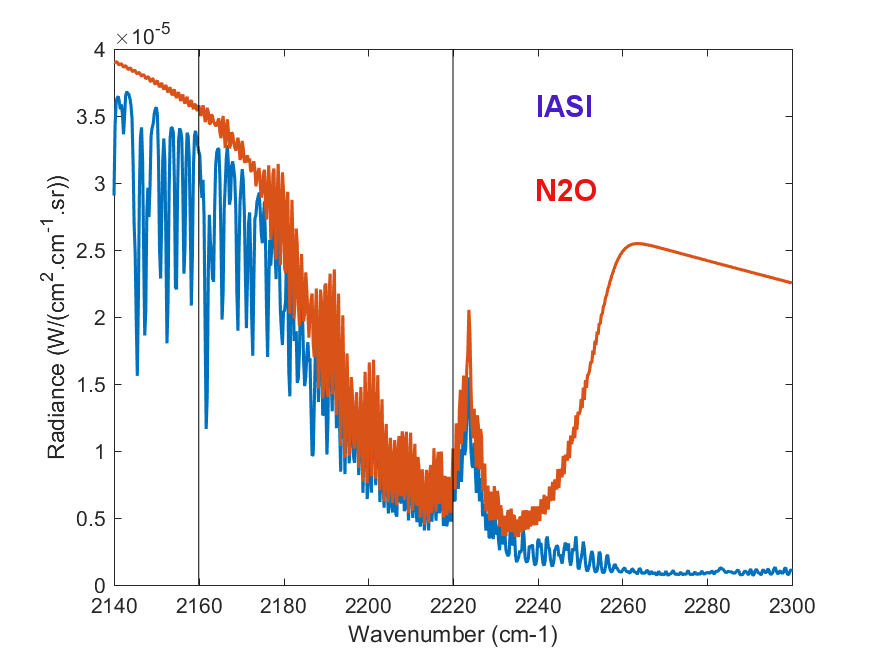
Figure 1: radiance in the 2140 – 2300 cm-1 window as observed by IASI (blue line) and contribution from the N2O absorption (orange).
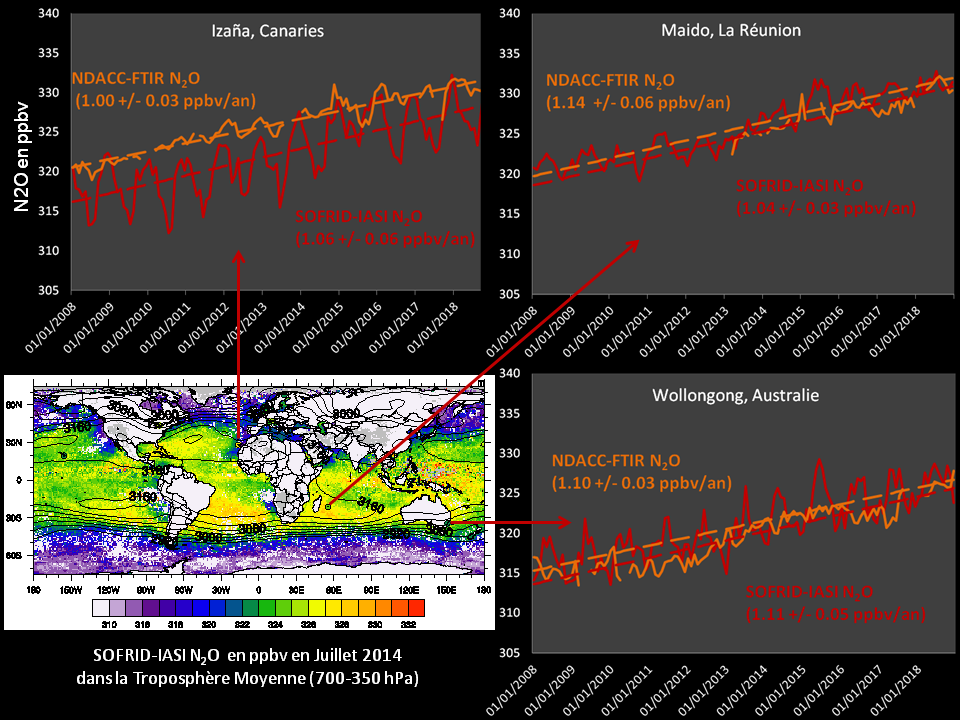
Figure 2: N2O mixing ratios in the middle troposphere (700–350 hPa): global map of SOFRID-N2O and 2008–2018 time series at three NDACC stations. The N2O accumulation trends (dashed lines) have been computed from linear regressions.
Full story: Barret, B., Gouzenes, Y., Le Flochmoën, E., and Ferrant, S. Retrieval of Metop-A/IASI N2O profiles and validation with NDACC FTIR data, Atmosphere 2021, 12(2), 219, https://doi.org/10.3390/atmos12020219
Contacts: brice.barret@aero.obs-mip.fr (LAERO/OMP) and sylvain.ferrant@ird.fr (CESBIO/OMP)