With help from the NDACC Data Host Facility, the Theory and Analysis Working Group has uploaded model support files to the NDACC data archive. There are two types of content, one customized for the FTIR group and the other for the Lidar, Dobson, and Sonde working groups. File content is based on each group’s request for constituent and meteorological fields. The support files were created from a Hindcast simulation produced by the NASA Global Modeling Initiative (GMI) chemistry transport model integrated with MERRA (reanalysis) meteorology. Individual station data files, each containing 1 year of model output, are available for years 1992 to 2014. The files are written in netCDF format.
The files written for the Lidar, Dobson, and Sonde stations contain hourly vertical profiles of O3, NO2, H2O, temperature, pressure, and potential vorticity on a geometric altitude coordinate with 1 km resolution. The FTIR station files consist of daily profile and column quantities for 10 atmospheric species, including O3, N2O, CH4, and HCl. Basic meteorological quantities are also included. The FTIR species are reported on 72 pressure levels between the surface and 0.01 hPa. Details of each file type’s content can be found in a ‘readme’ file in the model data subdirectory of the NDACC data archive.
The GMI chemistry transport model integrated with MERRA meteorology produces realistic simulations of the atmospheric composition of the recent past. The GMI output can be used to determine the effects of irregular temporal sampling at a station. When used in combination with the full, 3D GMI simulation, differences between station data and the zonal mean indicate the representativeness of a station. This is particularly relevant for the attribution and interpretation of long-term trends. The GMI simulation builds a bridge between the irregular space/time sampling of ground-based measurements and the global perspective.
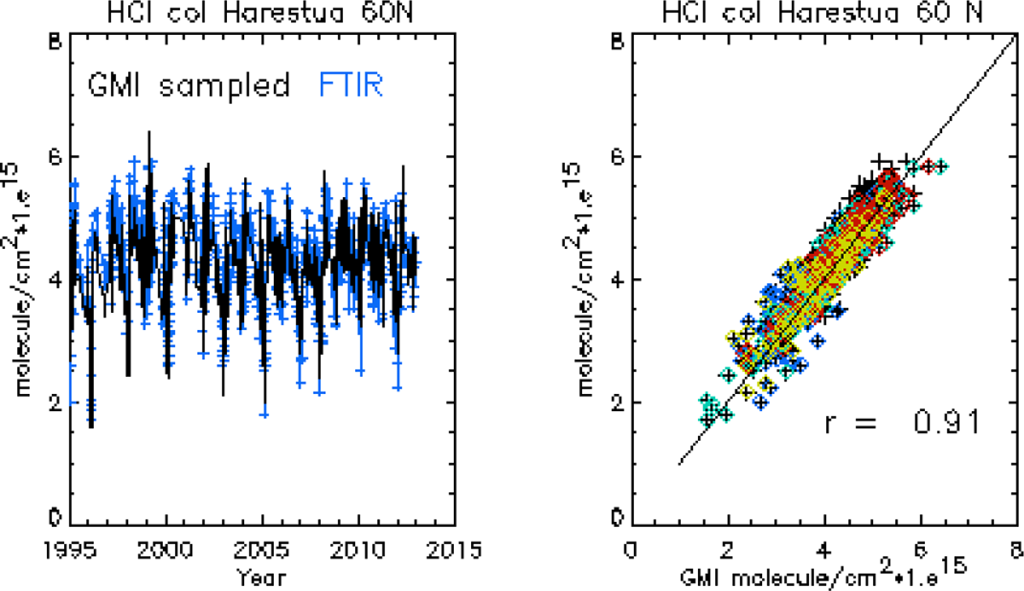
Left panel: The GMI simulation captures the observed seasonal, interannual, and decadal variability column HCl measured at Harestua, Norway (60N, 10E). Right panel: Scatterplot of the points in the left panel, demonstrating excellent agreement. Similar agreement is found at midlatitudes. The colors indicate different seasons.