For 2023 and beyond, model support for the FTIR, Lidar, Dobson, and Sonde working groups will be provided from a GEOS called Replay. Replay meteorology is very close to MERRA2, particularly below 10 hPa. It is run with the same chemistry mechanism as the GMI CTM. You will find a similar level of agreement between Replay and observed time series as you do with the CTM and observations. The Replay simulation that’s being used to create support files of the WGs is called ‘MINDS’. The MINDS simulation currently has full years 1996-2020 available. This simulation will be continued.
The contents of the Replay support files for these working groups are almost exactly the same as in the GMI CTM files. In addition to the trace gas species you’re accustomed to, you’ll also find Age of Air. For the FTIR files, the species output are now daily averages (previously, 12Z ‘snapshots’ or monthly means). It was no longer possible to provide the daily latitude of the vortex edge in the FTIR files, but you’ll find the potential vorticity and the age of air are very useful for identifying excursions into and out of the polar vortex; both of these fields are found in the Replay files. For the lidar, Dobson, and sonde files, the species are output 8 times per day as 3-hr averages rather than hourly instantaneous data.
Replay model support files were created from the ‘MINDS’ simulation, which was integrated at 0.25 degree horizontal resolution and 72 vertical levels. Support files are now available for download from the NDACC archive for FTIR, lidar, Dobson, and sonde sites for 1996-2020 (2021 and 2022 not yet available).
Download files from the NDACC DHF.
Your new point of contact for model support is Sarah Strode at NASA Goddard Space Flight Center. Susan Strahan, is still available for questions, but she may take a week to respond. Contact information is in the README files at the DHF.
Below are examples of plots that compare O3 and some key trace gases measured by Lidar and FTIR with the GMI CTM and Replay simulations. The full array of plots are available with the README files.
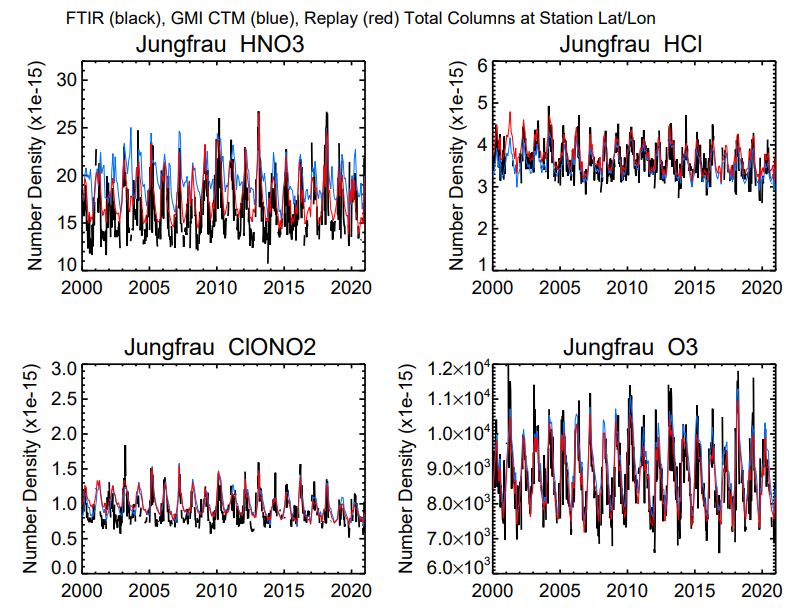
Figure 1: Observed and simulated total columns of HNO3 , HCl, O3 , and ClONO2 from 2000-2020 at 7 FTIR sites from 78S to 67N.
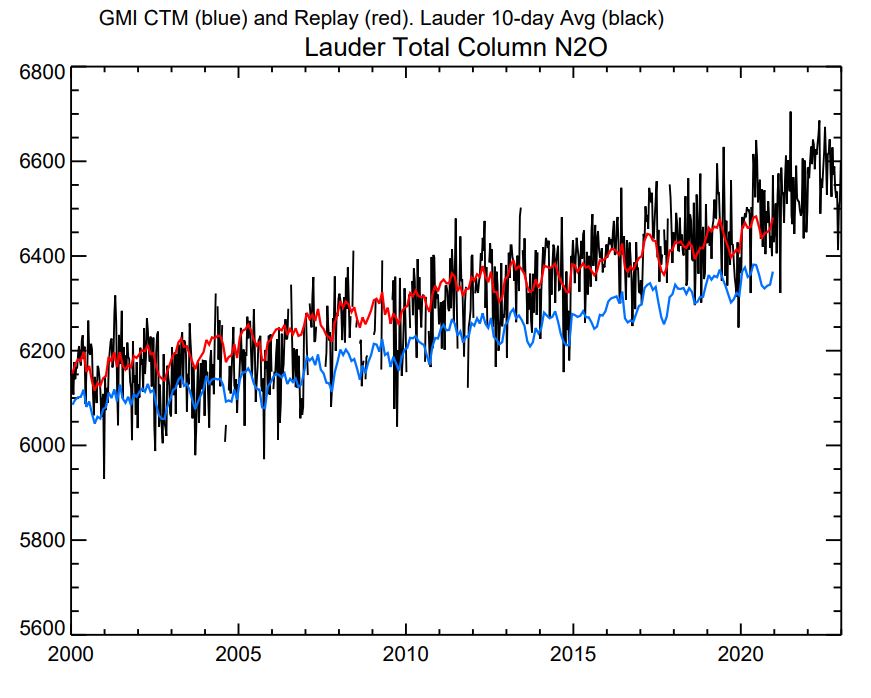
Figure 2: Observed and simulated total column N2O at Lauder, 2000-2020.
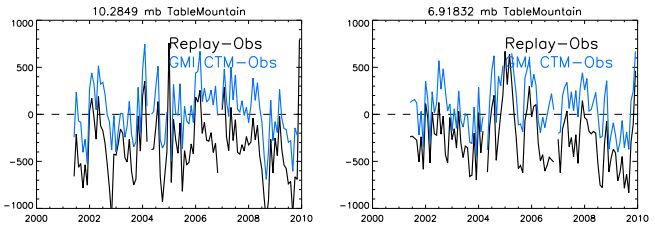
Figure 3: Differences between monthly mean observed and simulated O3 time series on 8 levels from 100-3 hPa from 4 Lidar sites, 2000-2020. (Absolute values (in ppb) and percentages).
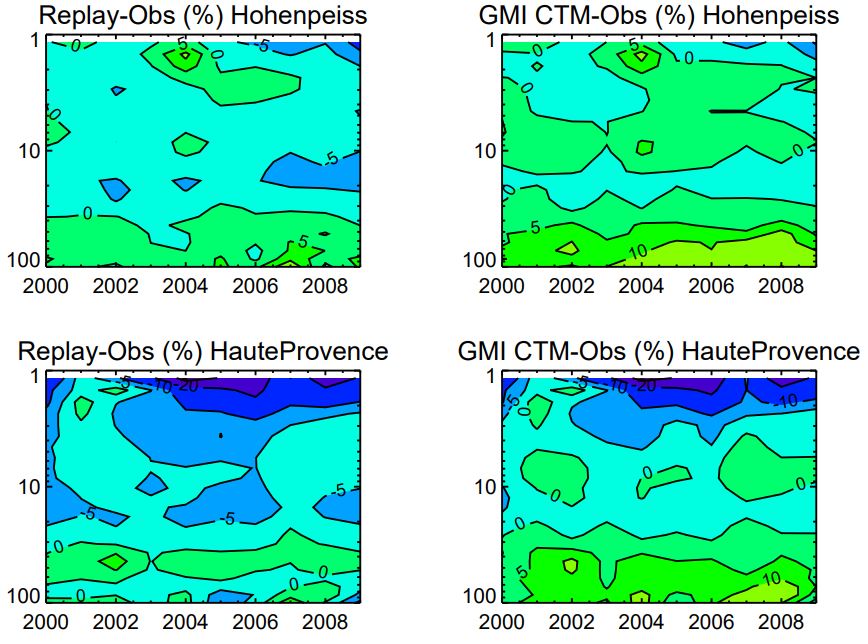
Figure 4: Time v. pressure level contoured differences between observed and simulated O3 from 100-1 hPa from 4 Lidar sites, 2000-2020. (Absolute values (in ppb) and percentages)