GAIA-CLIM (Gap Analysis for Integrated Atmospheric ECV Climate Monitoring) is a now completed EU H2020 Copernicus pioneering project (2015–2018). It had the aim to identify gaps and establish sound methods to characterize satellite-based observations using ground-based network measurements (http://www.gaia-clim.eu/). The backbone of the Copernicus Earth Observation programme is the acquisition of high-quality observational datasets from satellites. These need to be calibrated and validated to standards that enable them to be used with confidence for a range of different applications such as trend analyses. This, in turn, requires ground-based datasets of appropriate quality and quantity to robustly characterise satellite data products and their generation process.
Robust satellite data characterisation is about significantly more than simply where and when a given corresponding set of satellite and ground-based measurements is taken. It requires, in addition, quantified uncertainty estimation for the ground-based reference measurements and an understanding of the additional uncertainties that accrue and increase the apparent discrepancy between measured data sets through mismatches in time, location and resolution.
To address the above issues, a range of tools have been developed and demonstrated within GAIA-CLIM which might be useful to the NDACC community. These have been presented to the NDACC Steering Committee and other interested groups as part of a road show and several presentations over the last years. The tools are described in this news article and the links to access these tools and examples in particular relevant for NDACC data products are provided as well.
1. Maturity Matrix Assessment (MMA)
The CORE-CLIMAX Maturity Matrix Assessment (MMA) method (Schulz et al., 2017) endorsed by CEOS and CGMS for satellite-based Climate Data Records (CDR) was further developed within GAIA-CLIM to assess various quantifiable facets of the maturity of measurement networks such as NDACC. The MMA represents a semi-quantitative classification of a set of parameters, and its use is primarily to assign networks into relevant use-categories using three tiers of measurement capabilities: reference, baseline and comprehensive (see Thorne et al., 2017). This first attempt at systematically and consistently assessing the maturity of a list of 43 networks is documented on the GAIA-CLIM webpage at http://www.gaia-clim.eu/page/maturity-matrix-assessment.
There are seven major strands assessed within the GAIA-CLIM MMA as shown in Figure 1 for NDACC below, and each of these strands have two or more sub-categories. Guidance for completion of an assessment is available on the GAIA-CLIM webpage (http://www.gaia-clim.eu/page/maturity-matrix-assessment). The MMA can be used both to aid user decision making as to which measurement series are suitable for particular use cases and to aid measurement system owners in improving the maturity of their measurements. Within GAIA-CLIM, all maturity assessments have been made at the network level and thus scores are representative of the level of the overall maturity of each network and not of individual sites.
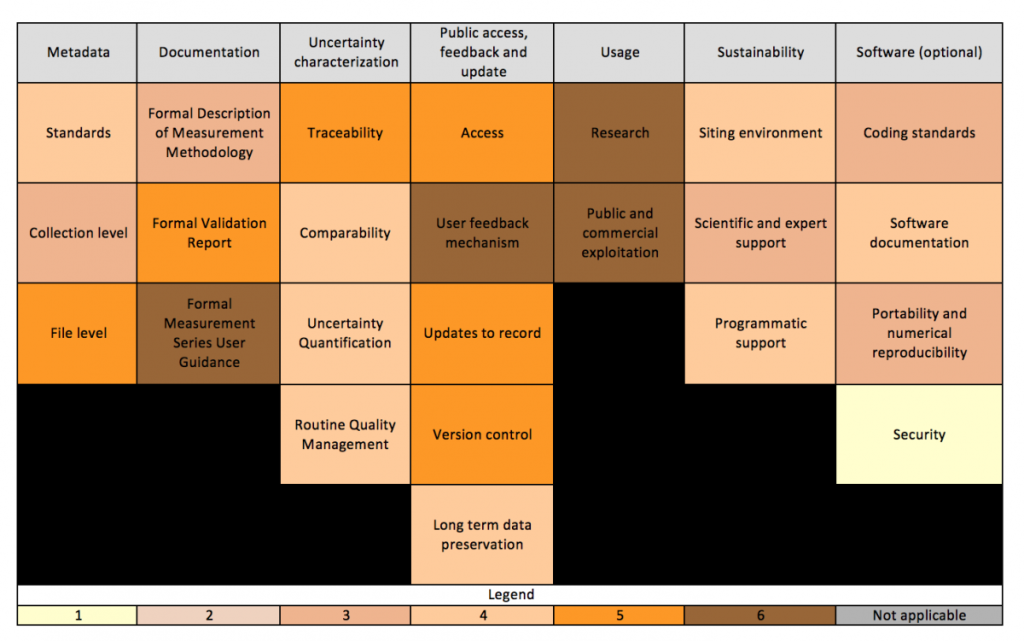
Figure 1: Example of an MMA of NDACC. The score provided for each subcategory indicates the measurement maturity level with a score of 1 or 2 corresponding to comprehensive, a score of 3 and 4 to baseline and a score of 5 and 6 to reference quality measurement capability.
2. Traceability diagrams and uncertainty documentation
Product Traceability and Uncertainty (PTU) represents a consistent metrological (measurement science) based approach to understanding measurement systems and their data analysis procedures. The key foundation is a traceability diagram that fully outlines the processing steps from SI units or internationally agreed standards to the final reported data product. These chains comprehensively identify all steps in the measurement (forward model) and retrieval (inverse model) processing procedure and hence help to identify the individual uncertainty components. Examples for NDACC measurement techniques (in particular lidar, FTIR and UV-vis,) can be accessed at http://www.gaia-clim.eu/page/traceability-model-diagrams.
Then, each step in that chain is described with the help of an ‘effects table’ that illustrates in detail the uncertainty associated with each of the processing steps. A fully traceable product must have all relevant steps listed that are expected to contribute to the total uncertainty. Each PTU document ends with a summary as to whether such a status has been attained and with recommendations for future work. Examples for PTU documents for specific data products, such as NDACC ozone profiles measured at Kiruna and Izaña using FTIR or ozone total columns measured at Harestua and Jungfraujoch using UV-vis spectroscopy, can be found at http://www.gaia-clim.eu/page/product-traceability-and-uncertainty-docum….
3. Smoothing and co-location uncertainty libraries
A meaningful comparison between satellite and ground-based measurements requires the rigorous treatment of so-called co-location mismatch uncertainties. Two measurement systems never probe exactly the same air mass, as the result of (1) differences in smoothing and sampling properties of the two observing systems (2) in an atmosphere that is highly inhomogeneous and variable at these scales. Within GAIA-CLIM, generic principles have been described and several methods have been developed for - and demonstrated on - the quantification of smoothing and sampling uncertainties for a list of satellite and ground-based measurement techniques, that need to be taken into account for a proper interpretation of their apparent discrepancies.
Of practical interest to the NDACC community are the libraries of smoothing and co-location uncertainty estimates for total ozone measurements, produced with the OSSSMOSE measurement system simulator specifically for each individual site hosting a Brewer, Dobson, or ZSL-DOAS instrument. These uncertainty estimates are provided both in the form of information sheets and as netCDF data files at ftp://ftp-ae.oma.be/dist/GAIA-CLIM/D3_6/Ozone/BIRA/. An example of co-location uncertainty at Kerguelen Island (Southern Indian Ocean) in October is shown in Figure 2. The methodology is described in GAIA-CLIM deliverable D3.6 at http://www.gaia-clim.eu/document/library-1-smoothingsampling-error-esti… and in Verhoelst et al., AMT v8, 2015. Also available are more generic Look-Up Tables that enable a quick estimation of co-location mismatch anywhere on the globe and a first assessment of smoothing and sampling uncertainties in ground-based ozone profile measurements (sonde, MWR, FTIR, and LIDAR).
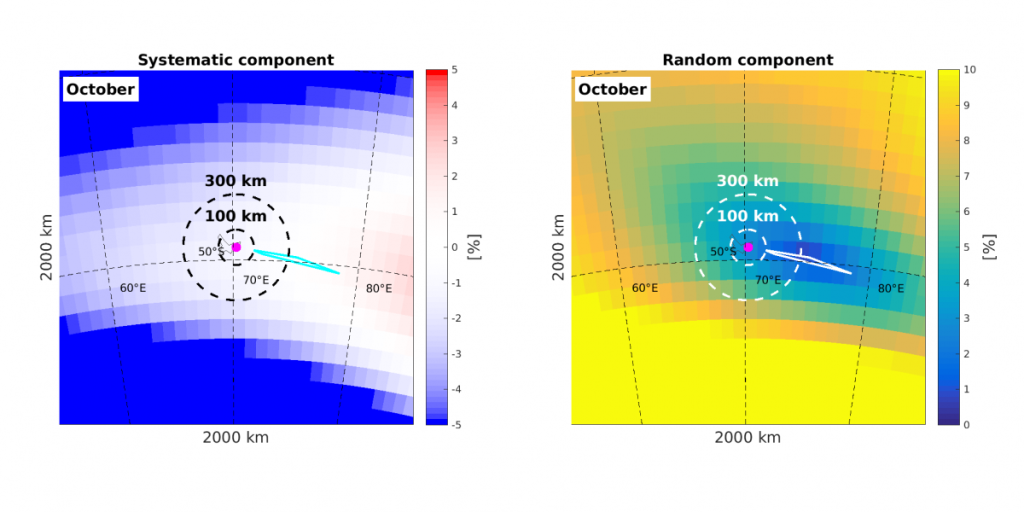
Figure 2: Estimated systematic and random component of the co-location uncertainty in comparisons against sunrise measurements with the SAOZ UV-visible instrument operated by LATMOS at Kerguelen Island, Southern Indian Ocean, as a function of spatial separation (assuming simultaneous measurements). The magenta marker represents the instrument location, and the cyan or white polygon the footprint of the actual sensitivity of the zenith-sky measurements at twilight (nominal measurement mode). This is an excerpt from the Kerguelen Island co-location information sheet.
4. Virtual Observatory (VO)
The GAIA-CLIM Virtual Observatory (VO) is providing a platform for co-located satellite and ground-based observations including statistics and uncertainty propagation information. It has been developed as a demonstrator tool and in its current status, the VO provides co-located datasets for the following key ECVs: Temperature, humidity, aerosols, ozone, and brightness temperature. The VO visualizes the observed parameters (e.g. ozone total columns and profiles) together with the measurement uncertainties and the unavoidable additional uncertainties due to processing for data sparseness and vertical smoothing, harmonization of profiles, etc. Co-located data can be directly downloaded to enable an offline analyse and e.g. the video tutorial on ozone shows clearly the potential of such a tool for users. Access to the GAIA-CLIM VO and relevant user information is available via https://www.gaia-clim.eu/page/virtual-observatory.
5. Gaps Assessment and Impacts Document (GAID) and recommendations document
The GAID is not so much a tool but rather a comprehensive reference list of scientific gaps in ground-based ECV monitoring and satellite validation as identified within the GAIA-CLIM project. The gap assessment process leading to this reference list consisted of 3 consecutive steps which were: 1) To identify the most important limitations of the non-satellite observations and networks for characterising satellite observations for climate monitoring, 2) to assess these gaps and to evaluate their user impact for climate services and research, and 3) to create a set of specific potential remedies to address the identified gaps.
The full details on all gaps are available in an online ‘catalogue of gaps’ and can be accessed via http://www.gaia-clim.eu/page/gap-reference-list. The webpage also provides a search function which allows the user to filter the gaps along different cross-sections, such as the type of gap and suggested remedies, instrument techniques, ECVs, etc.
The recommendations document (http://www.gaia-clim.eu/page/recommendations) distils and prioritizes the findings from the gap analysis into a set of 11 actionable high-level activities which provide recommendations for possible future research activities. A table of the titles of these 11 recommendations as well as the complete recommendation document are also made available on the GAIA-CLIM web page (>http://www.gaia-clim.eu/page/recommendations).
Article provided by Karin Kreher (BKS, New Zealand), Jean-Christopher Lambert, Tjil Verhoelst Martine De Maziere (BIRA, Belgium).
References:
Schulz, J., John, V., Kaiser-Weiss, A., Merchant, C.,Tan, D., Swinnen, E., and Roebeling, R.: European climate data record capacity assessment, Geosci. Data J., in preparation, 2017.
Thorne, P. W., Madonna, F., Schulz, J., Oakley, T., Ingleby, B., Rosoldi, M., Tramutola, E., Arola, A., Buschmann, M., Mikalsen, A. C., Davy, R., Voces, C., Kreher, K., De Maziere, M., and Pappalardo, G.: Making better sense of the mosaic of environmental measurement networks: a system-of-systems approach and quantitative assessment, Geosci. Instrum. Method. Data Syst., 6, 453–472, https://doi.org/10.5194/gi-6-453-2017, 2017.
Verhoelst, T., Granville, J., Hendrick, F., Köhler, U., Lerot, C., Pommereau, J.-P., Redondas, A., Van Roozendael, M., and Lambert, J.-C.: Metrology of ground-based satellite validation: co-location mismatch and smoothing issues of total ozone comparisons, Atmos. Meas. Tech., 8, 5039–5062, https://doi.org/10.5194/amt-8-5039-2015, 2015.