New output for 2018 is available for all stations. All file types from 1985-2017 have been revised – either corrected or improved; see details below. The new files have ‘MR2V2’ in the name to distinguish them as version 2 (V2) files that were created from a simulation integrated with MERRA2. All files can be downloaded via anonymous ftp from ModelDataLink. The files are generated from a GMI chemistry transport model (CTM) simulation integrated with MERRA2 reanalysis meteorology.
Thanks go to NDACC instrument working group members using GMI support files for Dobson and Lidar stations who noticed problems with model/data agreement. Because of their valuable feedback I was able to identify problems in mapping model output to geometric altitude. This affected all the hourly profile fields. Also, all fields in the new files are now reported with 0.75 km vertical resolution. The revised files have been evaluated by users – so I think they are correct! There are no known problems with the FTIR files.
Files for all lidar, sonde, and Dobson stations contain hourly vertical profiles of O3, NO2, H2O, temperature, pressure, and potential vorticity at 0.75 km resolution from the surface to 60 or 0-75 km, depending on the variable. The higher vertical resolution mapping better captures small laminae in the profiles that were smoothed over by the 1 km resolution. This is the only change in format. Output is now available for 5 southern hemisphere Dobson stations that recently joined NDACC: MacQuarie Island, Melbourne, Brisbane, Perth, and Darwin.
Model files for FTIR stations are mostly the same as before, but several species are now reported daily at local time of 1-2 pm rather than 12z. This may be especially helpful for species with diel variations measured at stations where 12z occurs in darkness. Temperature, pressure, and tropopause pressures are reported at both the 1-2 pm overpass time and 12z. The simulated species reported at 1-2 pm are O3, CO, CH2O, NO, and NO2; all other daily species are still reported at 12z. Formaldehyde (CH2O), now reported at 1-2 pm local, was previously reported as a monthly average. One new species, BrO, is now included in files and is reported as monthly averaged profiles and columns. Files for Altzomoni, Mexico are now available.
The figure shows the simulation’s ability to reproduce observed constituent variability from daily to seasonal timescales. Simulated station data are useful for understanding the variability and representativeness of NDACC measurements, thus building a bridge between individual station measurements and the global perspective. A brief description of the GMI CTM and its uses can be found at NDACCTheoryLink. Detailed information on the GMI CTM and this simulation (‘Hindcast-MERRA2’) can be found at GMI_Link.
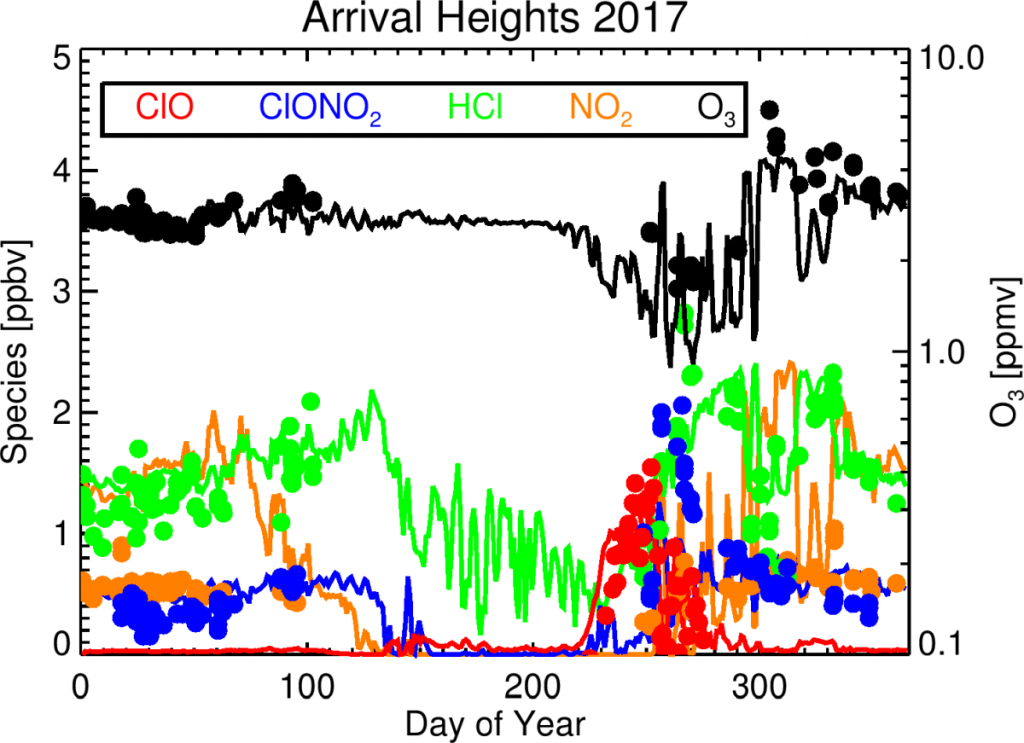
Ground based measurements (filled circles) and the GMI-MERRA2 simulation (lines) of ozone and other key species contributing to heterogeneous ozone destruction above Arrival Heights and Scott Base NDACC stations, Antarctica (77.82S,166.65E) in 2017. Ozone, HCl, NO2 and ClONO2 measurements are taken with a Fourier transform interferometer (FTIR), whereas the ClO measurements are made with a microwave radiometer. Constituent concentrations (ppbv or ppmv) are density weighted average volume mixing ratios over the altitude range 18-24 km (~73-35 hPa). Simulated species are shown for 12Z daily except for ClO, which is output at 0Z (midday at the stations’ longitude). All datasets (model and measurements) are available from the NDACC database. [Susan Strahan (NASA, USA), Dan Smale (NIWA,NZ),Gerald Nedoluha (NRL,USA)]
Do you need day/night or hourly values for a particular species? Just ask! We can rerun the model to save the special output you need. We know this matters for diurnally-varying species such as ClO and BrO. Additional fields may be available — contact Susan Strahan (susan dot strahan at nasa dot gov).