Worldwide efforts to contain spreading of the COVID-19 pandemic have reduced emissions from surface traffic by about 15% on average over the year 2020. Air-traffic (and emissions) went down by 40% on average.
Traffic is a main source of nitrogen oxides in the atmosphere, and much of the ozone in the troposphere is produced by photochemical reactions involving nitrogen oxides and volatile organic compounds (VOCs).
It is not surprising then, that NDACC ozone sondes, FTIRs, and tropospheric lidars recorded 7% less ozone in the free troposphere over the northern extratropics after the COVID-19 emission reductions. Reduced input from the 2020 stratospheric Arctic ozone hole to tropospheric ozone has contributed, but probably less then a quarter of the overall 7% decrease. Such low tropospheric ozone over several months and so many stations is unprecedented in the last 20 or more years. NDACC instruments are in a unique position to measure this, because many of the IAGOS air-planes were grounded, and tropospheric ozone is still difficult to measure from satellites.
For the whole story, see new GRL paper here https://doi.org/10.1029/2020GL091987
AGU press release: https://news.agu.org/press-release/lower-atmosphere-ozone-dropped-7-during-covid-19-pandemic-study-finds/
DWD press release: https://www.dwd.de/DE/presse/pressemitteilungen/DE/2021/20210217_pm_studie_ozon_troposphaere_news.html?nn=16210
RMI press release: https://www.meteo.be/fr/infos/actualite/lozone-nocif-diminue-en-reponse-aux-mesures-de-pandemie-de-covid-19-dans-lhemisphere-nord
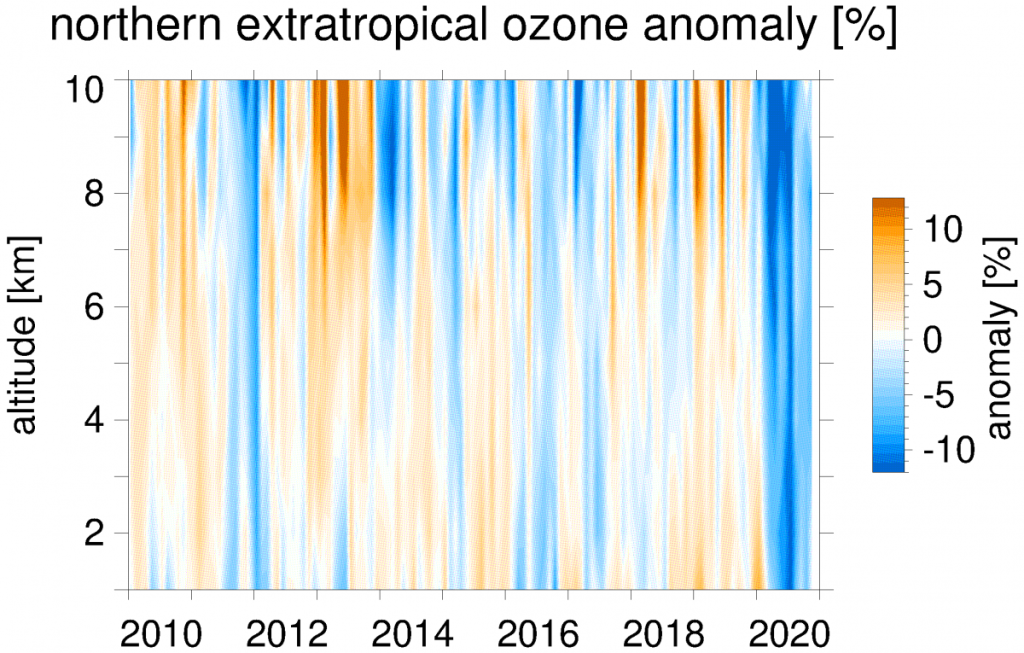
Figure 1: Color plot of ozone anomalies for the northern extra-tropics for the years 2010 to 2020 , and altitudes from 1 to 10 km. Red colors indicate more ozone than normal, blue colors less ozone than normal. The blue band in the year 2020 shows the unusually low ozone in the free troposphere, due to the COVID-19 lockdowns.
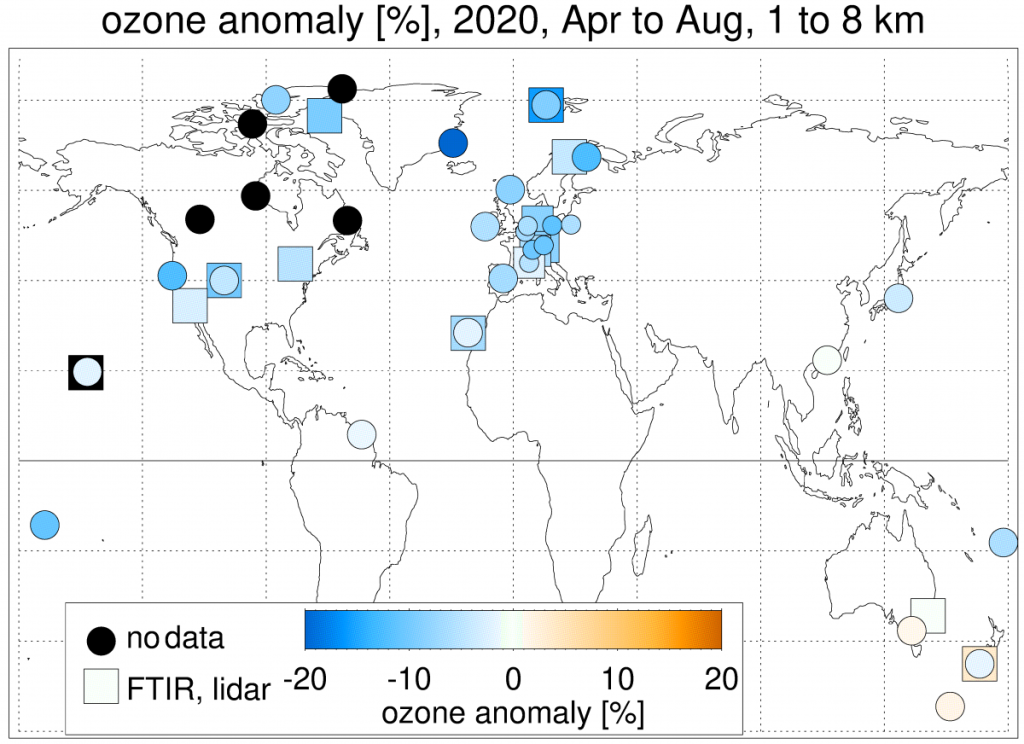
Figure 2: Map of NDACC stations and instruments used. Circles are for ozone sonde stations, squares are for FTIRs and lidars. The colors indicate the size of the ozone anomaly in spring and summer 2020. Blue colors indicate less ozone than normal, red colors more ozone than normal.