In a recent research study (Bahramvash-Shams et al, 2022a), performed a detailed analysis of recent Sudden Stratospheric Warmings (SSW) using the Modern-Era Retrospective Analysis for Research and Applications, Version 2 (MERRA-2) dataset. Reanalysis data are sophisticated and critical datasets in atmospheric science research that incorporate observational (largely satellite) data within data assimilation systems to provide continuous gridded datasets at high temporal frequency. Using independent measurements to validate the quality and uncertainty of the reanalysis data product is a key part of data production and helps guide suitability of the reanalysis for a given research study. Thorough characterization of uncertainties allows accurate interpretation by users by providing detailed information on the sensitivities and uncertainties of the reanalysis datasets.
This study took advantage of the continuous observations provided by the NDACC at five Arctic Infrared working group (IRWG) and ozonesonde stations, where vertical profiles of ozone are routinely measured consistently over the long term. These were used to assess the uncertainty of the MERRA-2 ozone dataset of highly disturbed dynamics during six major SSWs. The unusual dynamics during the SSW periods provide a stringent evaluation of the assimilated data product. As we show in the paper, the dynamical anomalies associated with the SSW can precede by several weeks and evolve through several weeks after the event. Although polar night precludes solar observations, there is an overlap with sondes and solar FTIR of various durations dependent on SSW date and latitude.
Nearest to measurement FTIR, ozonesonde and 3-hourly 0.5º × 0.625º gridded MERRA-2 data are used in the evaluation. To match the vertical resolution and incorporate FTIR vertical ozone sensitivity, a smoothing by the FTIR averaging kernels is applied to the MERRA-2 data. In this study, in consideration of the aggregate sensitivity of all FTIR retrievals, four partial ozone columns (PCO), namely surface–8 km, 8–15 km, 15–22 km, and 22–34 km, are considered.
The result of these comparisons showed the excellent agreement between MERRA-2 and the independent observations through the middle stratosphere. This is, in part, due to the assimilation of MLS ozone into MERRA-2 in this region. The quantification of the quality of ozone information through the middle stratosphere allowed a detailed analysis of ozone variability and associated dynamical modulators in this study.
The uncertainties, that are larger below 10 km, motivated us to investigate tropospheric ozone using the unique emission FTIR data set from Summit, Greenland to improve the MERRA-2 ozone estimation (Bahramvash_Shams et al, 2022b). This study, using MERRA-2 and ozonesonde and a novel retrieval scheme, illustrates the capabilities of emission FTIR to improve ozone estimate by reducing the bias and standard deviation below 7 km.
-----------------------------
Contact: Shima Bahramvash-Shams NCAR, Boulder, CO, USA (sshams@ucar.edu)
Bahramvash-Shams, S., Walden, V. P., Hannigan, J. W., Randel, W. J., Petropavlovskikh, I. V., Butler, A. H., and de la Ca ́mara, A. (2022). Analyzing ozone variations and uncertainties at high latitudes during sudden stratospheric warming events using MERRA-2. Atmospheric Chemistry and Physics, 22(8):5435–5458.
Shams, S. B., Walden, V. P., Hannigan, J. W., and Turner, D. D. (2022). Retrievals of Ozone in the Troposphere and Lower Stratosphere using FTIR Observations over Greenland. IEEE Transactions on Geoscience and Remote Sensing.
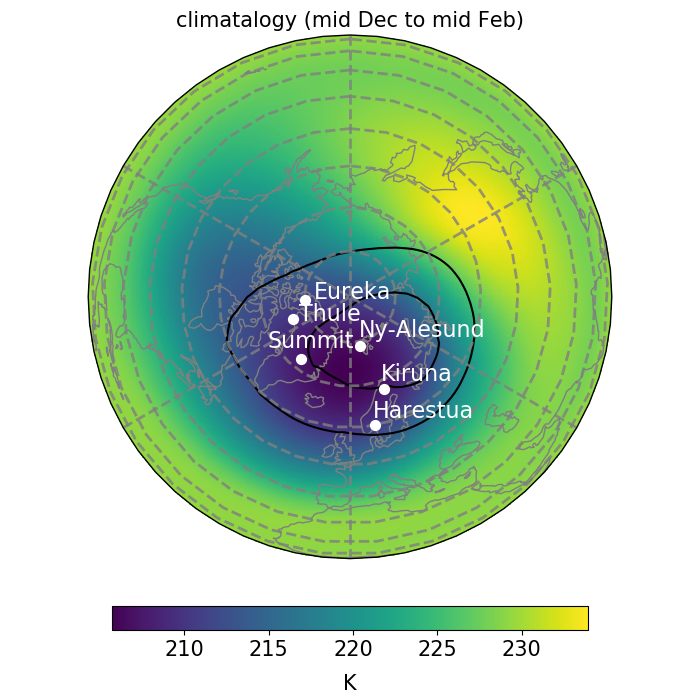
Fig 1. Map of station locations with climatological temperature at 10 hPa and EPV at the PT= 850 K during wintertime (DJF) over the Northern Hemisphere. The climatology is based on non-SSW years from 2004 to 2019. The map coloring shows the average winter temperature. The black contour lines are 600 and 800 EPV units (10−6 K m2 kg−1 s−1).
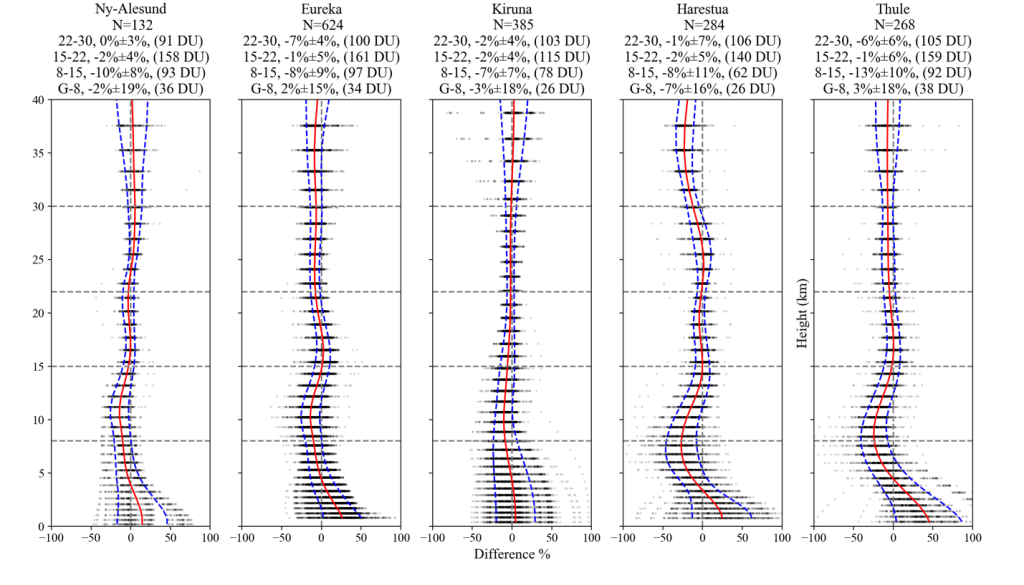
Fig. 2. Relative differences of FTIR retrieval and MERRA-2 at each layer at NDACC sites from 1 December to 1 May for 6 years of SSWs. The relative difference is ((MERRA-2 - FTIR) / FTIR) for each layer. The normalized mean bias is shown by the red line. The standard deviation of the relative differences from the normalized mean biases are shown by the blue lines. The number of coincident FTIR retrieval and MERRA-2 comparisons between 1 December and 1 May for the 6 years of SSWs (N ) is shown under each site name. Statistical summaries of the MERRA-2 and NDACC comparisons in four layers (ground to 8, 8–15, 15–22, and 22–30 km) for each station are shown above each plot. The average PCO value for each layer is shown in parentheses.