Monitoring the atmospheric HCFC-22 mole fraction and its long-term trend is important to the stratospheric ozone layer and climate change. Ground-based FTIR measurements within the NDACC-IWRG community provide a powerful technique for observing atmospheric trace gases. However, as many subtle components of a retrieval can have an effect on the results, it’s imperative that a harmonized retrieval, meaning all aspects of the acquisition, processing and retrieval, are as identical as possible. This effort is at the core of the NDACC-IRWG. In this study, we propose a harmonized FTIR HCFC-22 retrieval strategy and generate a global NDACC-IRWG HCFC-22 data set at 16 contributing FTIR stations. The calculated systematic and random uncertainties are 5.3%–8.7% and 3.2%–8.0%, respectively. Based on these new FTIR HCFC-22 measurements, the HCFC-22 annual growth rates between 1990 and 2023 are evaluated. A maximum of the HCFC-22 tropospheric dry air mole fraction annual growth rate was observed in 2009 with a global mean of 7.65 ± 1.39 ppt/year, after which the annual growth rate decreased to 3.57 ± 1.39 ppt/year (2016–2020) then 2.15 ± 2.09 ppt/year (2021–2023). The results are compared with two independent data sets: surface NOAA flask samplings and upper troposphere ACE-FTS satellite measurements. Good agreement among the three data sets is found, with a clear decrease in the growth rate of atmospheric HCFC-22 in recent years. According to the most recent Montreal Protocol agreements, HCFC-22 should be phased out within the next 5–6 years. The global FTIR observations will assure continuity into the next years and decades when HCFC-22 tropospheric concentrations are expected to decrease further after the official phase-out.
The paper is available at: Zhou, M., Langerock, B., Vigouroux, C., Smale, D., Toon, G., Polyakov, A., et al. (2024). Recent decreases in the growth rate of atmospheric HCFC-22 column derived from the ground-based FTIR harmonized retrievals at 16 NDACC sites. Geophysical Research Letters, 51, e2024GL112470. https://doi.org/10.1029/2024GL112470.
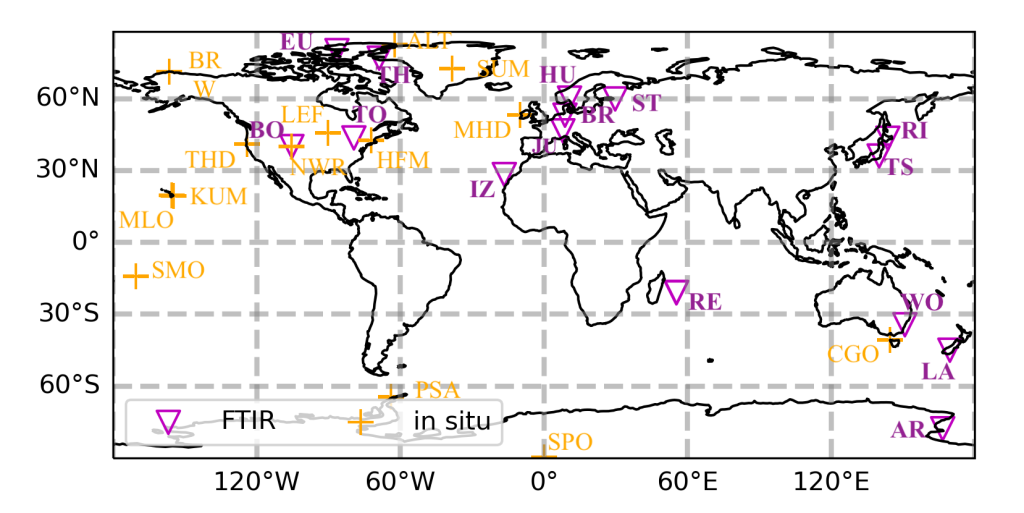
Figure 1. The location of the FTIR sites in this study as well as the NOAA in situ flask measurement sites.
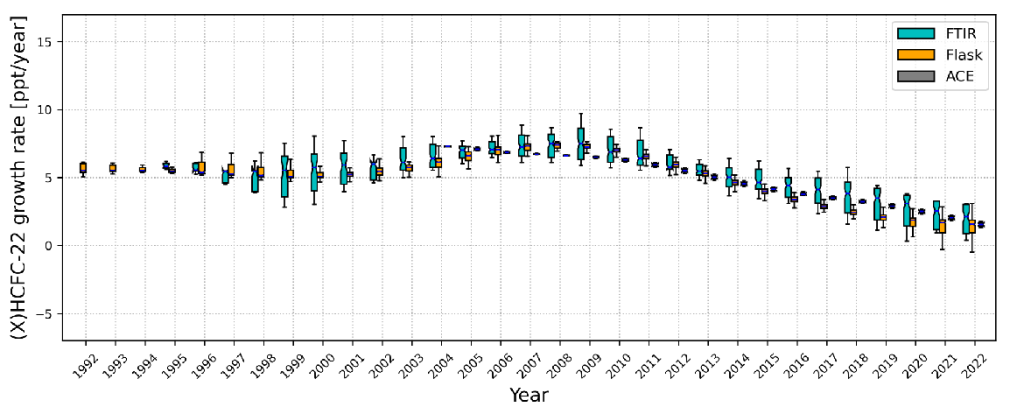
Figure 2. Box plot of the HCFC-22 annual growth rates derived from FTIR, co-located ACE-FTS satellite measurements, and all NOAA surface flask observations between 1992 and 2022.