The plot below illustrates that compared with seasonal and geographic differences in UV radiation, any trends at these three NDACC sites due to long-term ozone changes have been small since the 1990s when measurements began. Note that at Lauder prior to 1998 observations were not taken during precipitation, so the mean daily doses for this period are larger than for subsequent periods.
Image
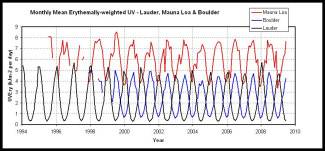
Figure. Time series of erythemally weighted UV at three NDACC sites