High quality spectral irradiance data from an NDACC site has demonstrated the relationship between erythemally weighted and vitamin d weighted UV.
Image
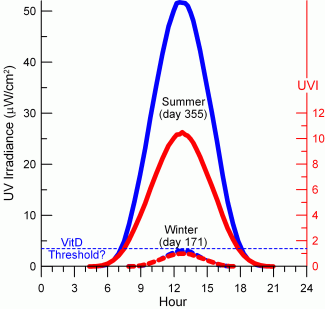
Figure 1. Relationship between UVEry and UVVitD on a summer and winter day at 45°S.
This has been used to estimate the optimal exposure times to receive sufficient UV for vitamin D production, yet without inducing sunburn.
Image
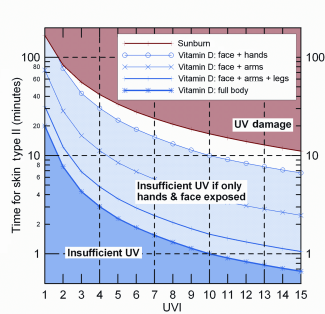
Figure 2. Exposure time for erythema and optimal vitamin D production as a function of UV Index for skin type II.
For more details, see McKenzie, R.L.; Liley, J.B.; Björn, L.O. (2009). UV Radiation: Balancing Risks and Benefits. Photochemistry and Photobiology 85, pp. 88–98.