The figure below is an example of the attribution of differences in UV between and Germany. Ratios of the average daily spectral irradiation for July/January 1998/99 from Garmisch and Lauder. By introducing modeled ratios to account for the differences of the major influencing parameter a spectrally flat graph can be produced. The remaining 20-25 % difference can be attributed to cloud differences between both stations.
Image
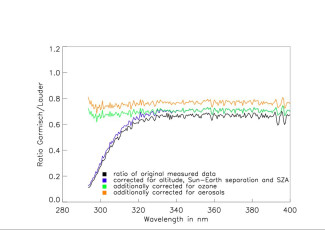
Figure. Attribution of differences.